Can you draw a Stress-Strain diagram with:
aluminum, steel, hardened steel, plastics/ceremics?
Any idea on which material to select with better performance in beam problem compared to aluminum?
Can you draw a Stress-Strain diagram with:
aluminum, steel, hardened steel, plastics/ceremics?
Any idea on which material to select with better performance in beam problem compared to aluminum?
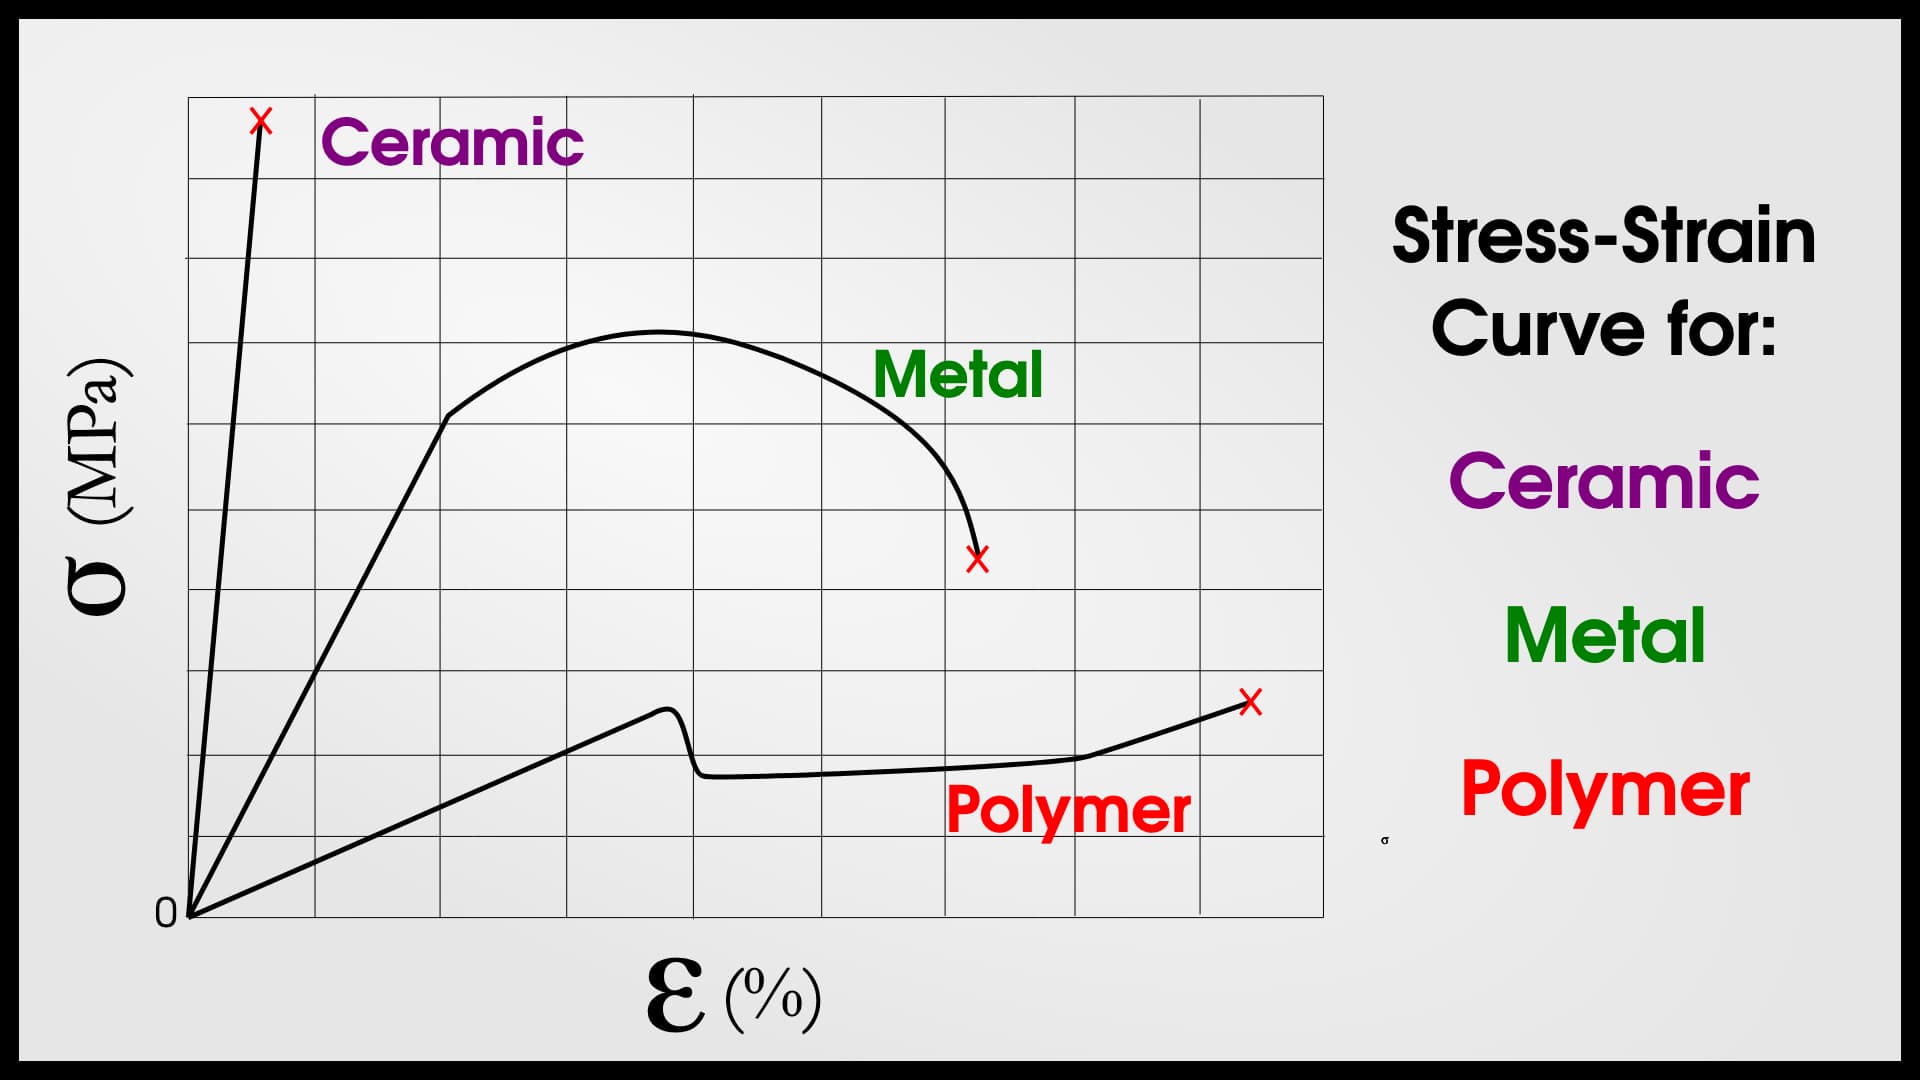
A general stress-strain curve for metals, polymers (i.e. plastics), and ceramics is shown below:
Ceramics are typically the strongest (Young’s Modulus), polymers have the greatest elongation (% strain = Change in Length/Original Length), and metals are often the toughest.
Let’s look at some important mechanical properties for each material:
Aluminum 6061
304 Stainless Steel
Delrin (Sample Representative Plastic)
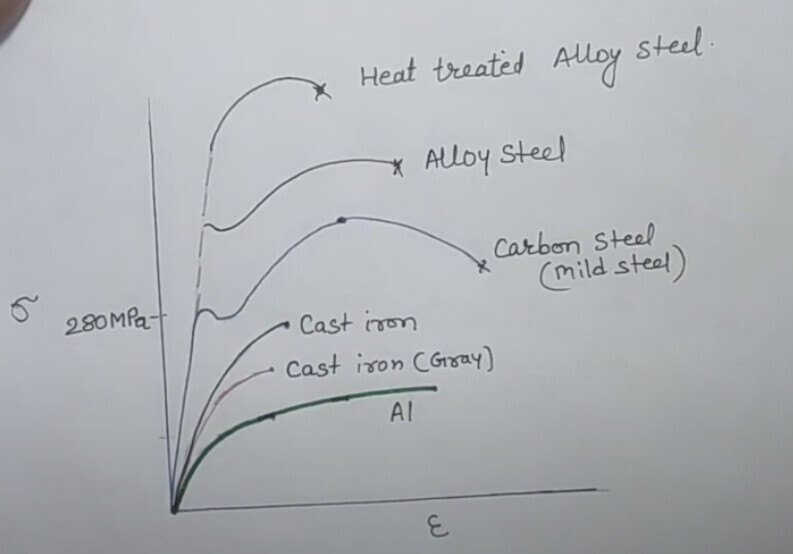
Values above are referenced this database of material properties, Make It From and MatWeb. For hardened steel, let’s assume we have some x MPa increase in both yield & tensile strength.
As such, we can see that the stress-strain curve would look similar to this for aluminum and different grades of steel: