Imagine you are given a diode and asked to draw its IV curve. Can you walk me through the steps you would take to create the curve? What key features would you expect to see on the graph, and how would you interpret them in terms of the diode’s behavior?
IV Curve Basics - IV (current-voltage) characteristic curves are typically utilized to determine and comprehend the fundamental parameters of a component or device. For a diode, the IV (current-voltage) curve for a diode shows the relationship between the voltage across the diode and the current flowing through it.
To create the curve, one would:
- Apply a series of voltages to the device
- Measure the current flowing through the device at each voltage
- Measure the supplied voltage with a voltmeter connected in parallel to the device
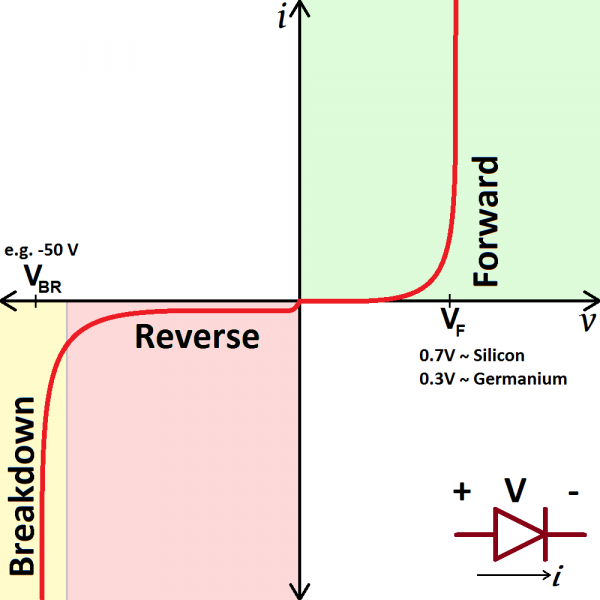
For an IV (current-voltage) curve of a diode, you would expect to see several key features:
- Forward Bias Region: Diode allows current to flow, acting as a low-resistance path once the threshold voltage is surpassed.
- Threshold Voltage (V_th): This is the voltage at which the diode begins to conduct significantly. Below this voltage, the current is very small.
- Exponential Increase: After the threshold voltage, the current increases exponentially with an increase in voltage. This region demonstrates the diode’s ability to conduct current easily when forward-biased.
- Reverse Bias Region: Diode has a very high resistance, allowing only a small leakage current to flow until the breakdown voltage is reached, at which point the current increases rapidly.
- Reverse Saturation Current (I_s): This is a very small current that flows when the diode is reverse-biased. It remains relatively constant over a range of reverse voltages.
- Breakdown Voltage (V_b): If the reverse voltage is increased significantly, the diode enters the breakdown region, where the current increases sharply. This can be due to either avalanche breakdown or Zener breakdown, depending on the diode type.