Vibration design…
2 Likes
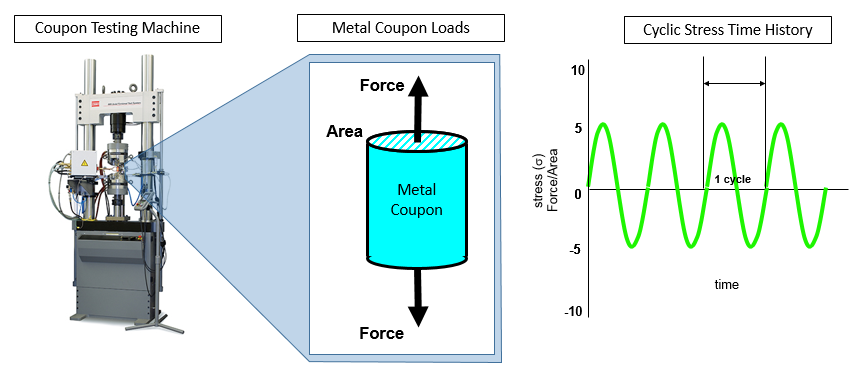
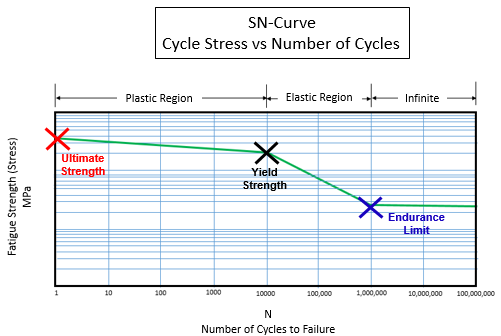
A S-N curve is a plot of the magnitude of an alternating stress versus number of cycles to failure for a given material. Knowing a load history (i.e. vibrations) over a number of cycles (exposure period), you can use a S-N curve to determine the fatigue life of a mechanical part.
S-N curves are created for a given material by using a metal coupon testing machine. These work by taking a small piece of metal, known as the coupon, and subjecting it to a cyclic/alternating stress time history until a crack/failure propagates. Several trials with different stress levels will be conducted to develop the S-N Curve.
Points on a S-N Curve directly correlate to a material’s stress-strain curve points.
1 Like